Introduction
GoAccess is a tool for monitoring web server logs in realtime, which written in C and can be accessed directly from the command-line. With GoAccess you can view or analyse relevant statistics quickly and securely. Apart from the command-lin dashboard interface, it’s also capable of displaying the statistics in other formats such as HTML, JSON, and CSV, which you can use in other contexts.
Installing GoAccess
It is easy to install GoAccess on Linux using package managers. For example, on Ubuntu:
sudo apt install goaccess
Note: This may not always give you the latest stable version. To make sure that you’re running the latest stable version see option below:
echo "deb http://deb.goaccess.io/ $(lsb_release -cs) main" | sudo tee -a /etc/apt/sources.list.d/goaccess.list
wget -O - https://deb.goaccess.io/gnugpg.key | sudo apt-key --keyring /etc/apt/trusted.gpg.d/goaccess.gpg add -
sudo apt update
sudo apt install goaccess
Editing the GoAccess configuration
Once you have installed GoAccess on your server, then you should be ready to start using it. However, first you need to determine the log format of your access log. GoAccess comes with a configuration file where you can make permanent changes to the behaviour of the program. You’ll edit this file to specify the time, date, and log format so that GoAccess knows how to parse the server logs.
To find out where the config file is located on your server, run the following command:
Example output:
/etc/goaccess/goaccess.conf
For me, it shows No default config file found., but I still can find the /etc/goaccess/goaccess.conf. Anyway, I will use that file for configuration.
Note: If this file does not exist on the server, ensure to create it first and populate it with the contents of the goaccess.conf file on GitHub.
Many of the lines in the file are commented out. To enable an option, remove the first # character in front of it.
Now, let’s set the basic configuration for a Nginx server by editing time-format, date-format, and log-format. Then save the file and exit the text editor, you’re now ready to run the GoAccess program to analyse some Nginx plain-text log files.
Accessing Nginx log files with GoAccess
sudo goaccess /var/log/nginx/access.log
It will prompt you to choose basic format setting. After that, it will launch the GoAccess command-line dashboard.
Or, you can specify the configuration file in the previous step for formatting:
sudo goaccess -p /etc/goaccess/goaccess.conf /var/log/nginx/access.log
Sometimes you will have several compressed log files on a long-running web server. To run GoAccess on all these files without extracting them first, you can pipe the output of the zcat command to goaccess:
zcat /var/log/nginx/access.log.*.gz | goaccess -a
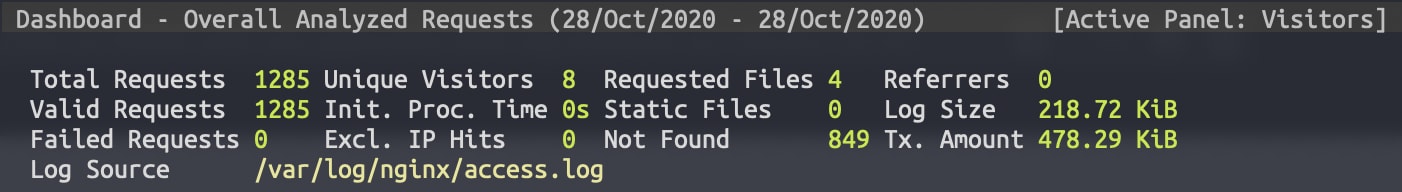
Navigating the terminal dashboard
At the top of the dashboard is a summary of several key metrics. This includes total requests for the reporting period, unique visitors, log size, 404 not found errors, requested files, size of the parsed log file, HTTP referrers, name of the log source, time taken to process the log file, and more…

Below the top panel, you will find all the available modules which provide more details on the aforementioned metrics and other data points supported by GoAccess. To navigate the interface, use the following keyboard shortcuts:
TAB - to move forward through the available modules and SHIFT + TAB to move backwards.F5 - to refresh the dashboard.g - to move to the top of the dashboard screen and G to move to the last item in the dashboard.o or ENTER - to expand the selected module.j and k - to scroll down and up within the active module.s - to display the sort options for the active module./ - to search across all modules and n to move to the next match.0-9 and SHIFT + 0 - to quickly activate the respective numbered module.? - to view the quick help dialogue.q - to quite the program.
Generating reports
GoAccess allows you to generate HTML, JSON, or CSV reports.
Make sure that you’re in the home directory before running any of the following commands.
To output the report as static HTML, specify an HTML file as the argument to the -o flag. This flag also accepts filenames that end in .json or .csv.
You can copy the output file to your local machine using scp, and view the report in your browser.
Real-Time HTML output
The following parses the access log and displays the status in a real-time HTML report.
sudo goaccess /var/log/nginx/access.log -o /var/www/html/report.html --log-format=COMBINED --real-time-html
Conclusion
Although we only covered how GoAccess may be used with Nginx logs, the powerful tool also supports other log formats such Apache, Amazon S3, Elastic Load Balancing, Google Cloud…
You can check the full GoAccess documentation or run man goaccess in your terminal.